
B2B Fintech Pricing: A Semi-Formal Look at Revenue Models
The playbook for what makes a startup venture-backable is being rewritten in real time. Metrics and models that once signaled a fundable business – predictable revenue, repeatable growth loops, distribution – still matter but have taken up new mechanics. Although revenue models and pricing aren’t sedentary, concrete, nor the highest priority for early-stage startups, an analysis on the topic could be a helpful gut check for folks entering more serious conversations with potential partners. Similarly, I thought it might be interesting to see if we can identify trends in how revenue models have shifted beyond just “SaaS is dead”. Thankfully, through gener8tor’s partnership with Curql, I have access to hundreds of fintech accelerator data points and used them to understand how the tech companies that move and protect money are making it themselves.
If you’re an early-stage founder reading this, remember, pricing is not something to overindulge on right now. Experimentation and stress testing for feedback should be your focus. You shouldn’t throw dry flies if there aren’t any fish sipping the surface and you shouldn’t be afraid to tie something new on if you’re getting skunked. You can’t force a revenue model that doesn’t match the nature of your product and you shouldn’t be unwilling to make concessions or experiment with what you catch. Hopefully this provides a real measuring stick versus a dart on a map or in other words, help you match the hatch.
Before I share what I found, here are a couple quick disclaimers:
(1) The data I worked with isn’t perfect. Out of 810 total potential data points, I found 685 that offered enough information to include in my analysis. As much as we all want there to be standardized nomenclature, not everyone adheres to such. I tried hard to parse through wording and made inferences to make the data set more robust when appropriate.
(2) I used Claude as a first pass to categorize my data. It made a few claims that I didn’t find particularly relevant or maybe more appropriately described as reaching. Specifically by trying to connect the dots on things that I intentionally left out or just didn’t have clear data on. For example, it drew a connection between transaction-based revenue models and the company's bootstrapping ability and connected higher lifetime revenues to lower funding activity. If I had to rate the performance of the LLM assistance overall, I would give it a B-. You could blame part of it on my prompting but I found plenty of inaccuracies or holey categorizations that I thought it would’ve sorted more accurately. Through my manual review, I easily corrected errors on more than 50% of Claude’s outputs but honestly, that’s just another score for the value of standardized startup language.
TL;DR
41.2% of B2B fintech reported monthly SaaS or annual licensing as their only revenue model.
14% of B2B fintech reported a transactional revenue model.
Usage-based model popularity increased +3.9% between ‘24 and ‘25 and +8% between ‘25 and ‘26.
Early-stage fintech are keeping it simple. 61.5% reported only having one revenue model.
Number of fly fishing references: 5.
Okay, now let’s get to the meat of it.
How many fintech are using recurring revenue models?
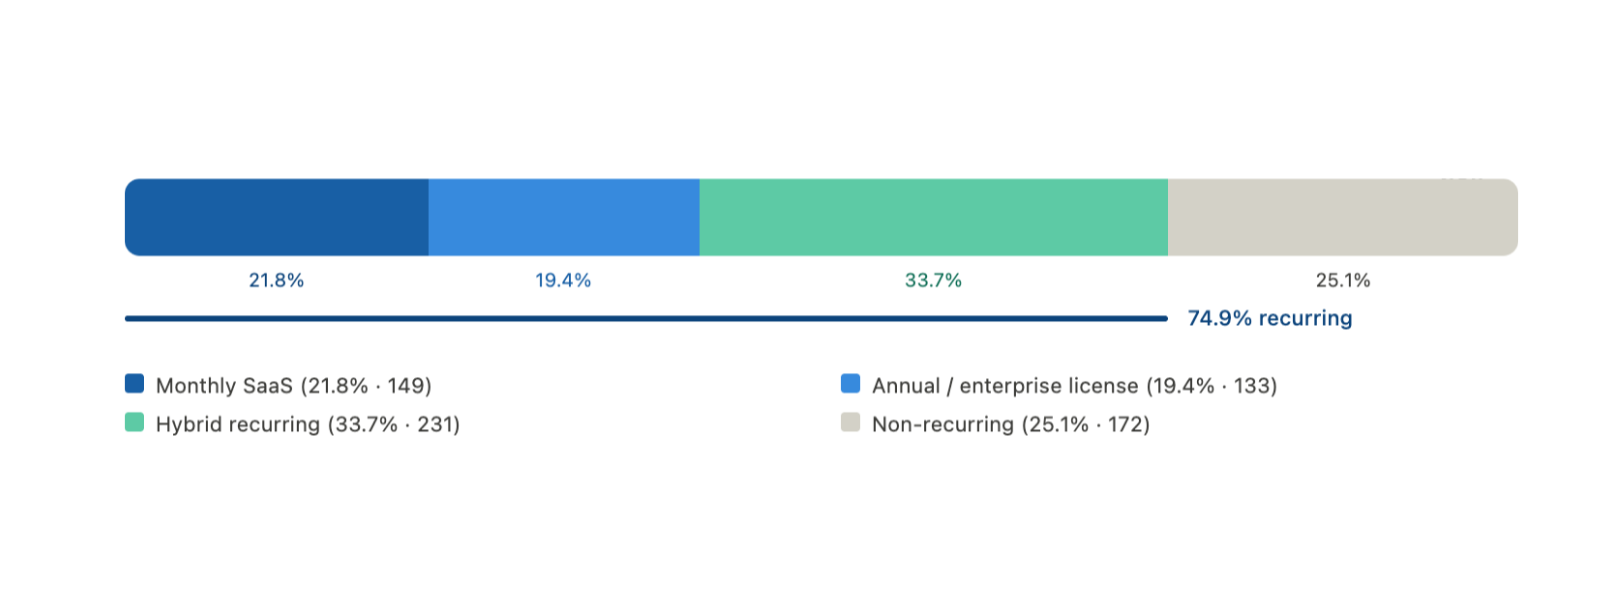
As you probably expected, the far majority of fintech reported using some form of recurring model. When I was double checking my data, I tagged any in this realm as either Monthly SaaS or Annual/Enterprise Licenses. 74.9% (513/685) of fintech reported one or both of these tags. If it were 2020, we might be batting closer to 1.000 in this category but 0.749 seems fair for 2026.
Now, if you’re only interested in pure play SaaS or are a “SaaS is dead” denier (I kinda am), you’ll be interested to know that less than half of fintech, 41.2% (282/685), specifically reported using monthly SaaS or annual licensing as their only model.
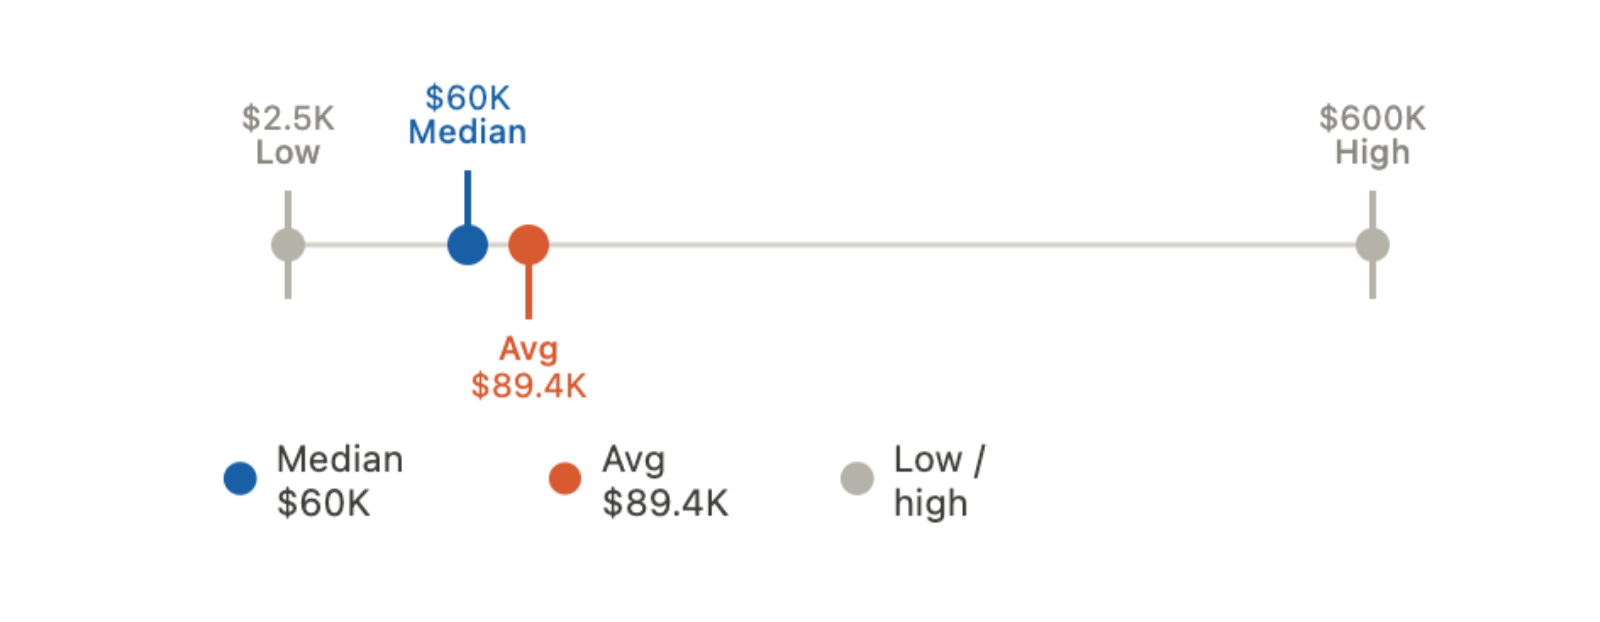
Converting monthly SaaS to annual pricing isn’t ideal but I was still curious to know what range these fintech are charging and where the average ACV fell. So, I extrapolated it anyways and found a high point ACV of $600K and a low of $2.5K. The median in this category was $60K and the average was $89.4K.
How many fintech are using transactional revenue models?
96 (14.0%) fintech reported a transactional model as their only revenue model but 108 (29.7%) more reported employing a transactional model alongside others. I think it’s important to delineate transactional from usage-based by describing transactional as a model that is dependent on a third-party input (# of loan applications for or transaction fees per card swipe is based on the applicant or the swiper) whereas a usage-based model is contained between the vendor and the customer (an underwriter running many risk scenarios using a specialized model). In other words, usage-based is a more grown-up version of the transaction model and one that covers some of the exposure that the latter can feel when there’s an economic squeeze. However, transactional models can also mean quicker distribution and lower adoption hurdles which are key upsides when dealing with long sales cycles and regulated buyers. Where both transactional and usage-based models align however, to quote my friend Nate from Cohen Circle, is on the “shift from inputs to outputs”. Outcomes drive and justify value and create positive reinforcement as opposed to a product holding inherent or upfront value. More on usage-basing below.
Let’s look at usage-based models.
Before you read on, pause, go to the comments and give me your best guess on what percent of fintech have a usage-based revenue mode. If you’re not that invested, fine, here’s your answer (really small so it doesn’t catch your eye if you guessed): 17.5%. That’s a smaller number than I expected myself (120 out of 685) but what surprised me even more is that only 22 fintech (3.2%) reported usage-based as their only model.
If there’s one interesting takeaway from this, it might be how the popularity of models are shifting. Anyone that was disappointed in the overall percentage of usage-based above can find some solace in the overall trend.
% of usage-based in 2024 - 35/278 = 12.6%
% of usage-based in 2025 - 31/188 = 16.5%
% of usage-based 2026 - 51/208 = 24.5%
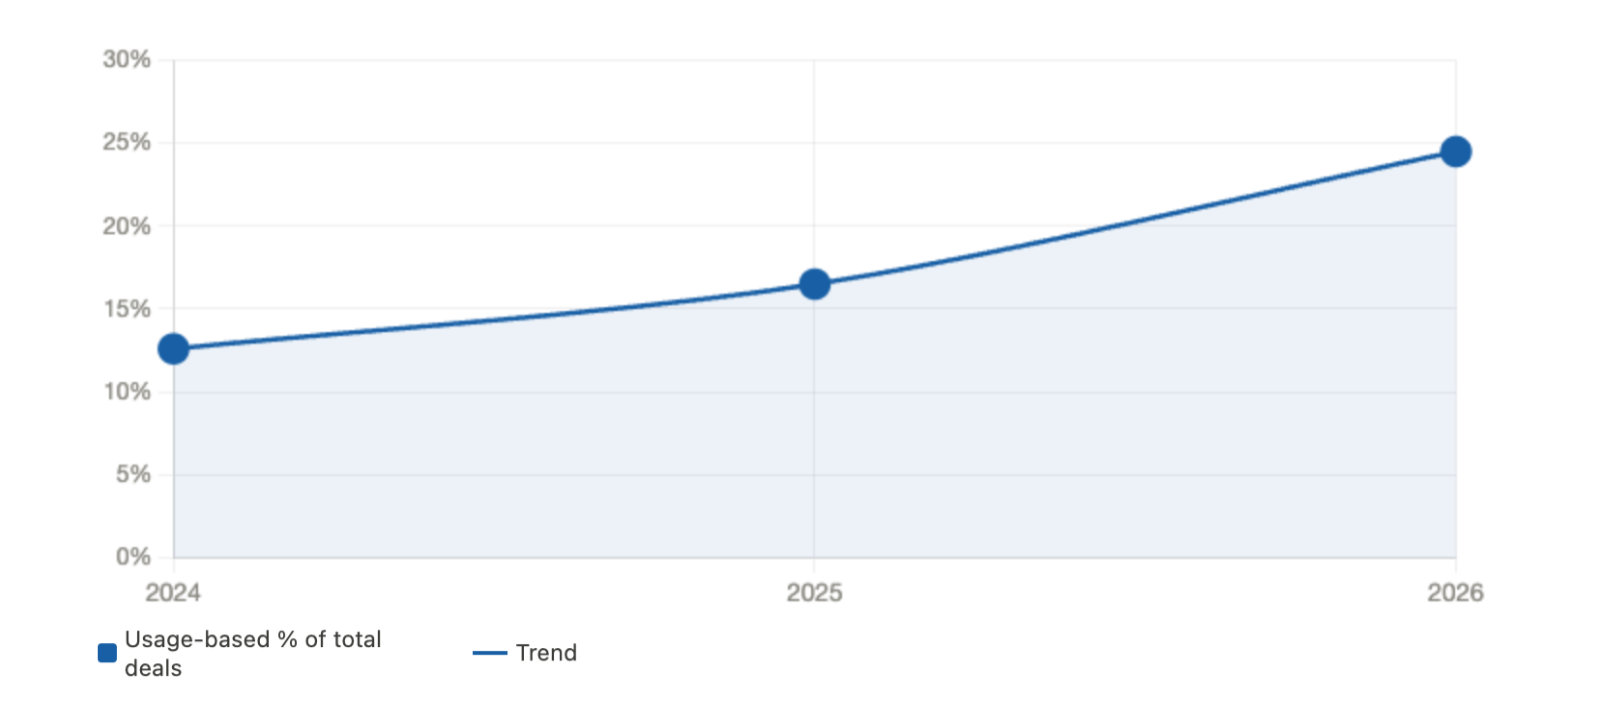
And that trend makes sense. If you think about companies that submitted data in 2024, the majority were likely incorporated 12-36 months prior to submitting their data. That would mean their core products and early revenue model validation fell well before the normalization of AI across most verticals and in turn, before usage-based models. It’s worth noting that the increase between ‘24 and ‘25 was ~4%. The jump from ‘25 to ‘26 on the other hand rose 8%, suggesting that the popularity of usage-based models is accelerating and matches our bubble buzz words.
Are fintech charging implementation fees and how much?
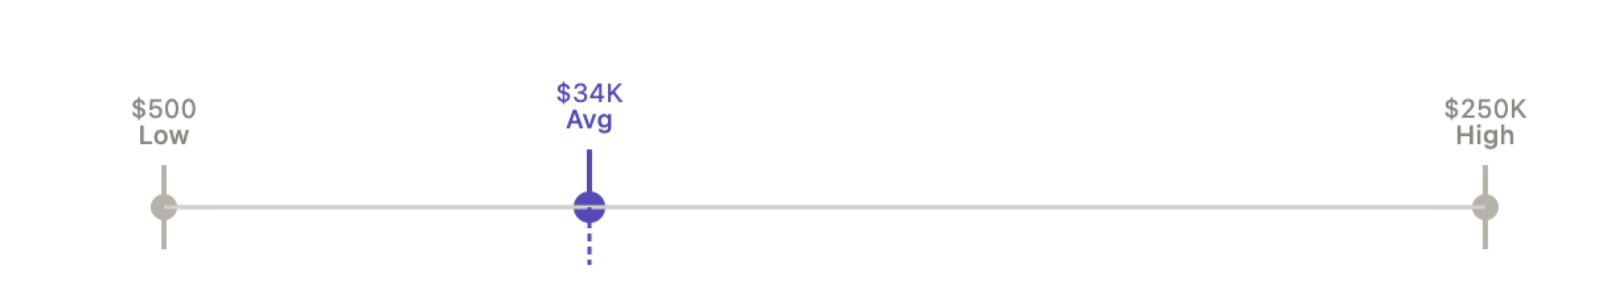
A surprisingly low number of fintech, 95 (13.9%), explicitly stated that they charge implementation fees with an average price point of $34K, ranging from $500 to $250K. If I had the time to talk to each founder that has submitted this data face to face, I would guess that most who do simply didn’t report as such, as they don’t factor it as a legitimate piece of their model. If we take a look at a subset, for example, the 20 fintech that are in my portfolio, roughly 75% of these companies are charging for implementation. While I day dream about the river, I’d equate this to using an indicator. A trout might turn their nose if it’s too big for them but if it’s just right, it’s a good signal.
Are revenue models focused or diversified?
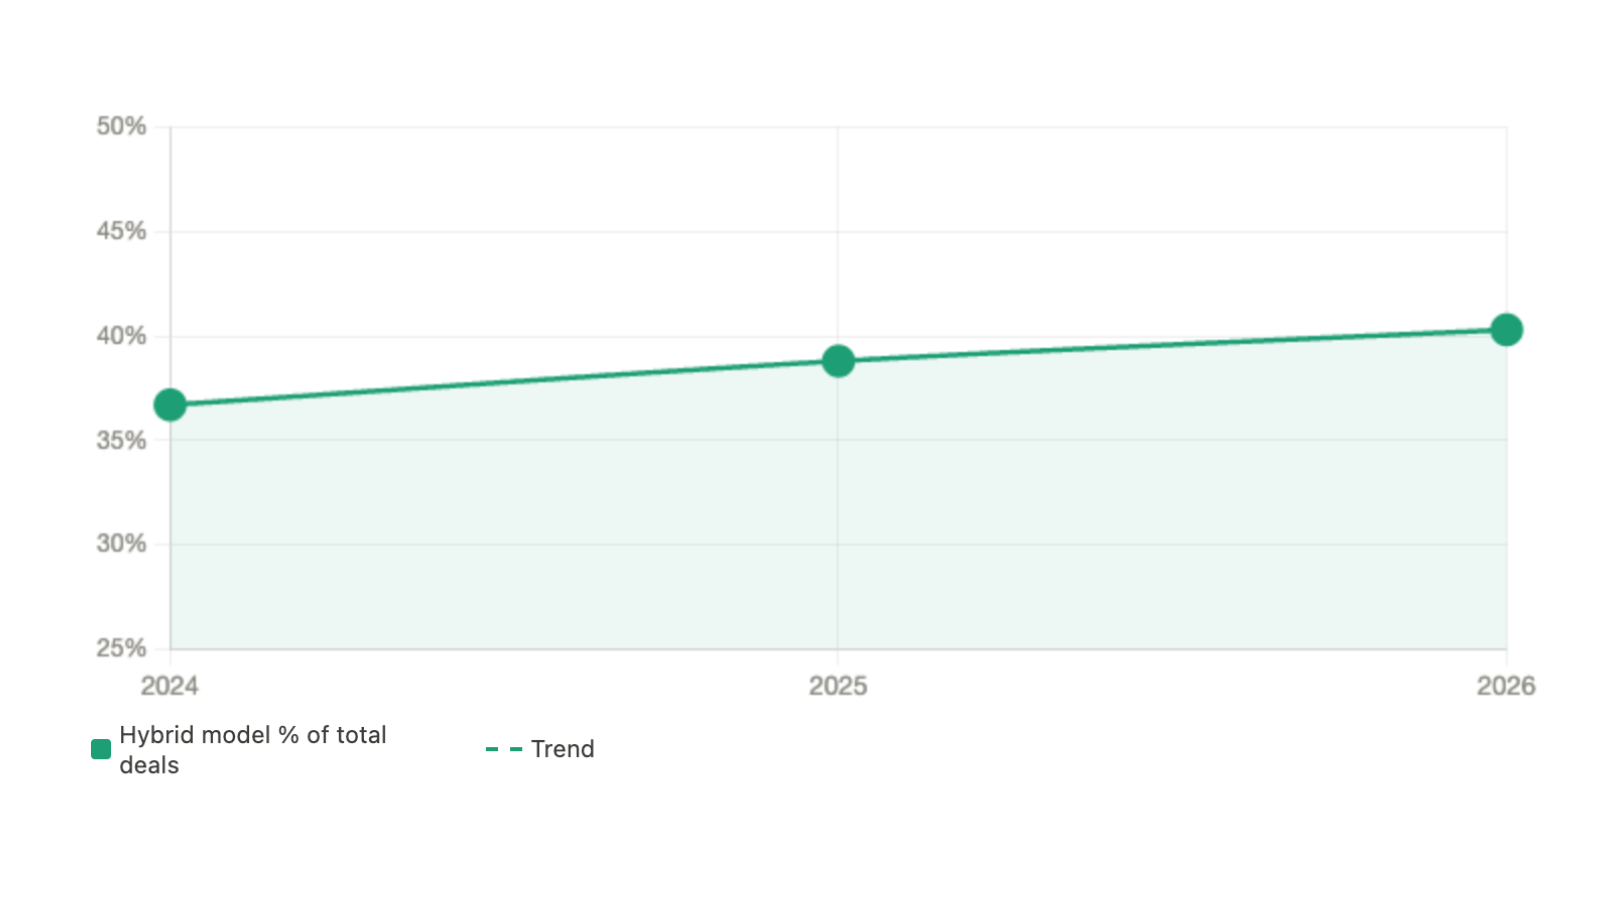
264 fintech reported a hybrid model (some combination of recurring license fees, transactional, usage-based, interest/spread/shared) and 421 fintech reported a single revenue model. With an ideal data set, it would be interesting to know how this impacts overall success or if better resourced, do fintech naturally diversify? But I don’t believe I have the data to support that. What I am confident in saying is that most fintech, at the earlier stage are keeping things simple. Which is good! They know what they are and they aren’t moving into the allure of platforming before they’re ready. Feature, not a bug. Attractor, not a detractor. To confuse you with some more technical fly language, the number of fishermen using double-dropper rigs is increasing almost 2% per year.
% of hybrid models in 2024 - 102/278 = 36.7%
% of hybrid models in 2025 - 73/188 = 38.8%
% of hybrid models in 2026 - 84/208 = 40.3%
Final thoughts
The nature of many B2B and B2B2C fintech is that they’re selling to mid-market or large enterprise customers. These orgs have money to spend on tech but they weigh immense regulatory and risk considerations. Fintech (and all startups) in general are the antithesis. Positioning yourself as a predictable bet on their balance sheet increases the chances you’ll move through the funnel. Despite the symphony that is a seamless partnership between fintech and regulated institutions, they don't usually start that way. Which is why you should optimize your revenue model and pricing in the early days, regardless of what kind, to be simple to understand, transparent and open to collaborative exploration with potential partners. The more lines you have in the water, the chances are higher that you’ll get tangled or snagged. Catching big fish is all about natural presentation.
Have other pricing questions you’re curious about? Did I miss something? Was this useful at all? I would appreciate your feedback in the comments or in a DM and let me know if you’re passing through Salt Lake City, I’d be happy to give a casting lesson 🎣.
Written by Rowan Hume